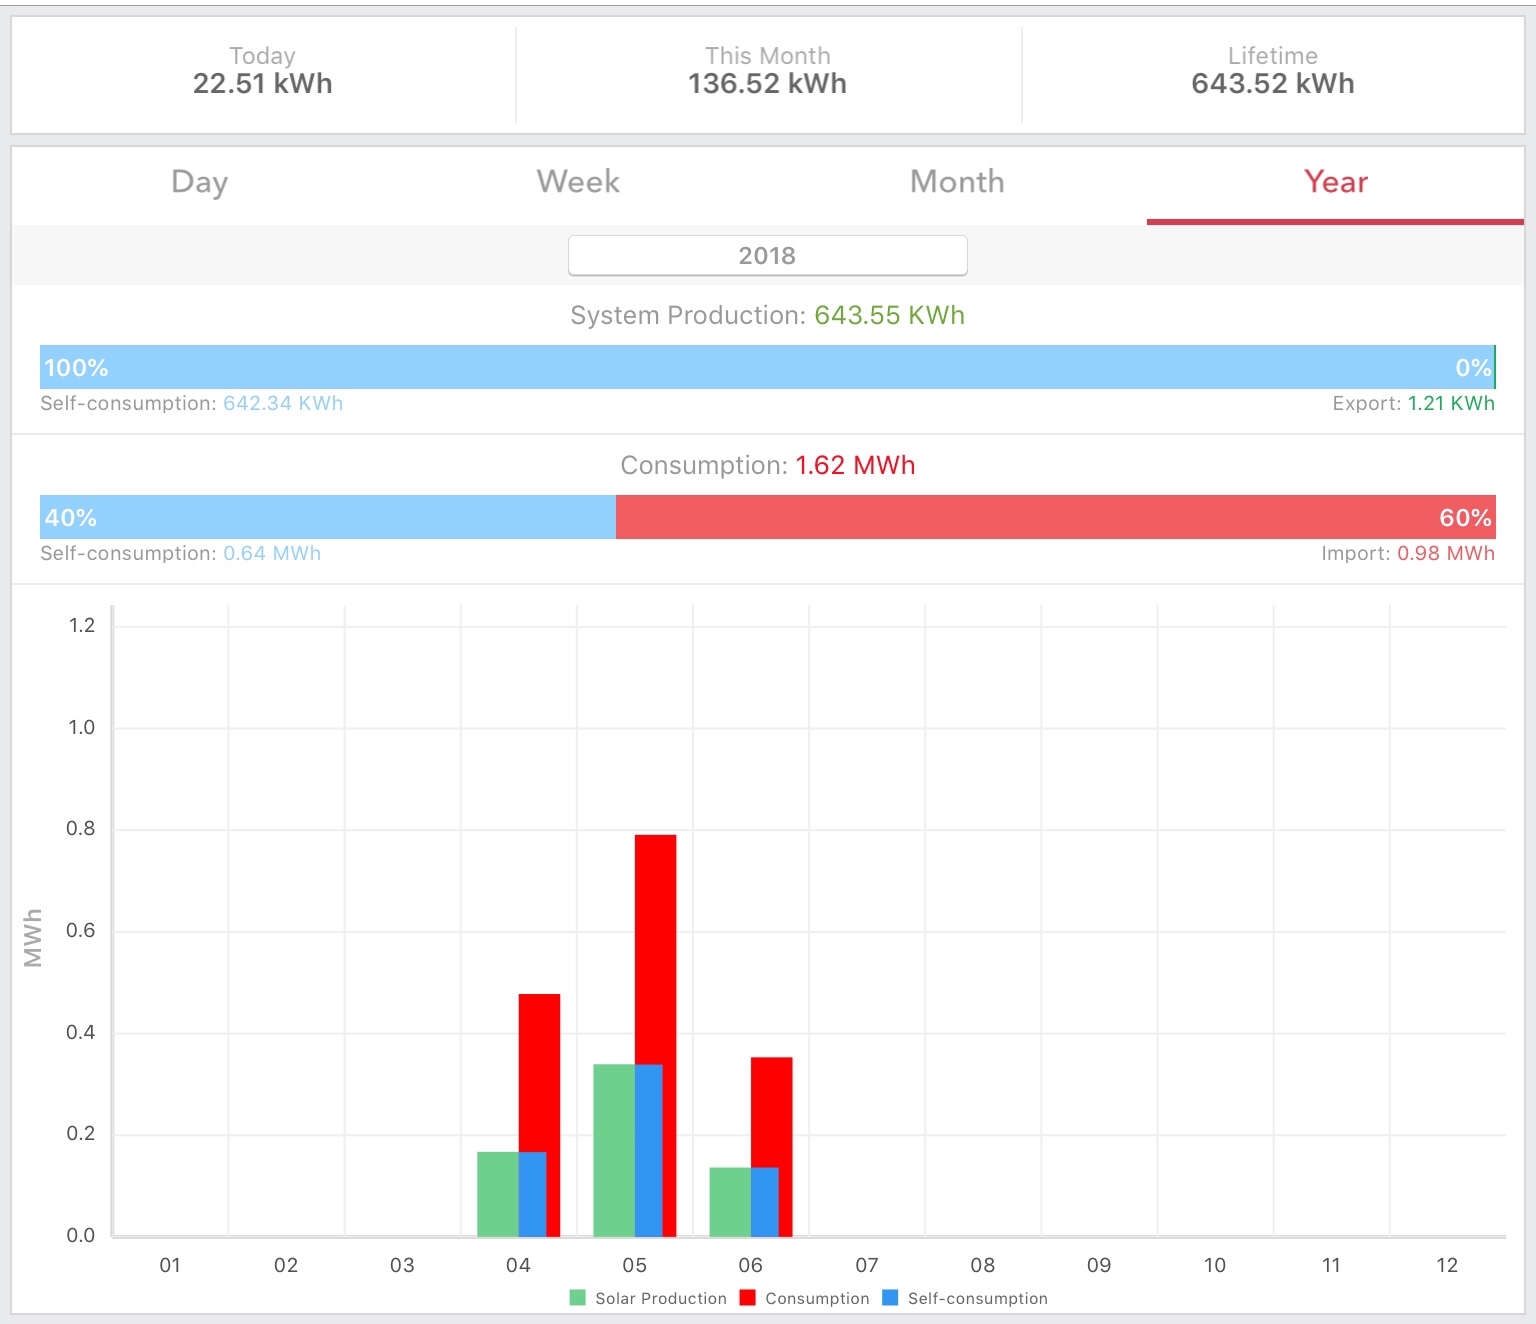
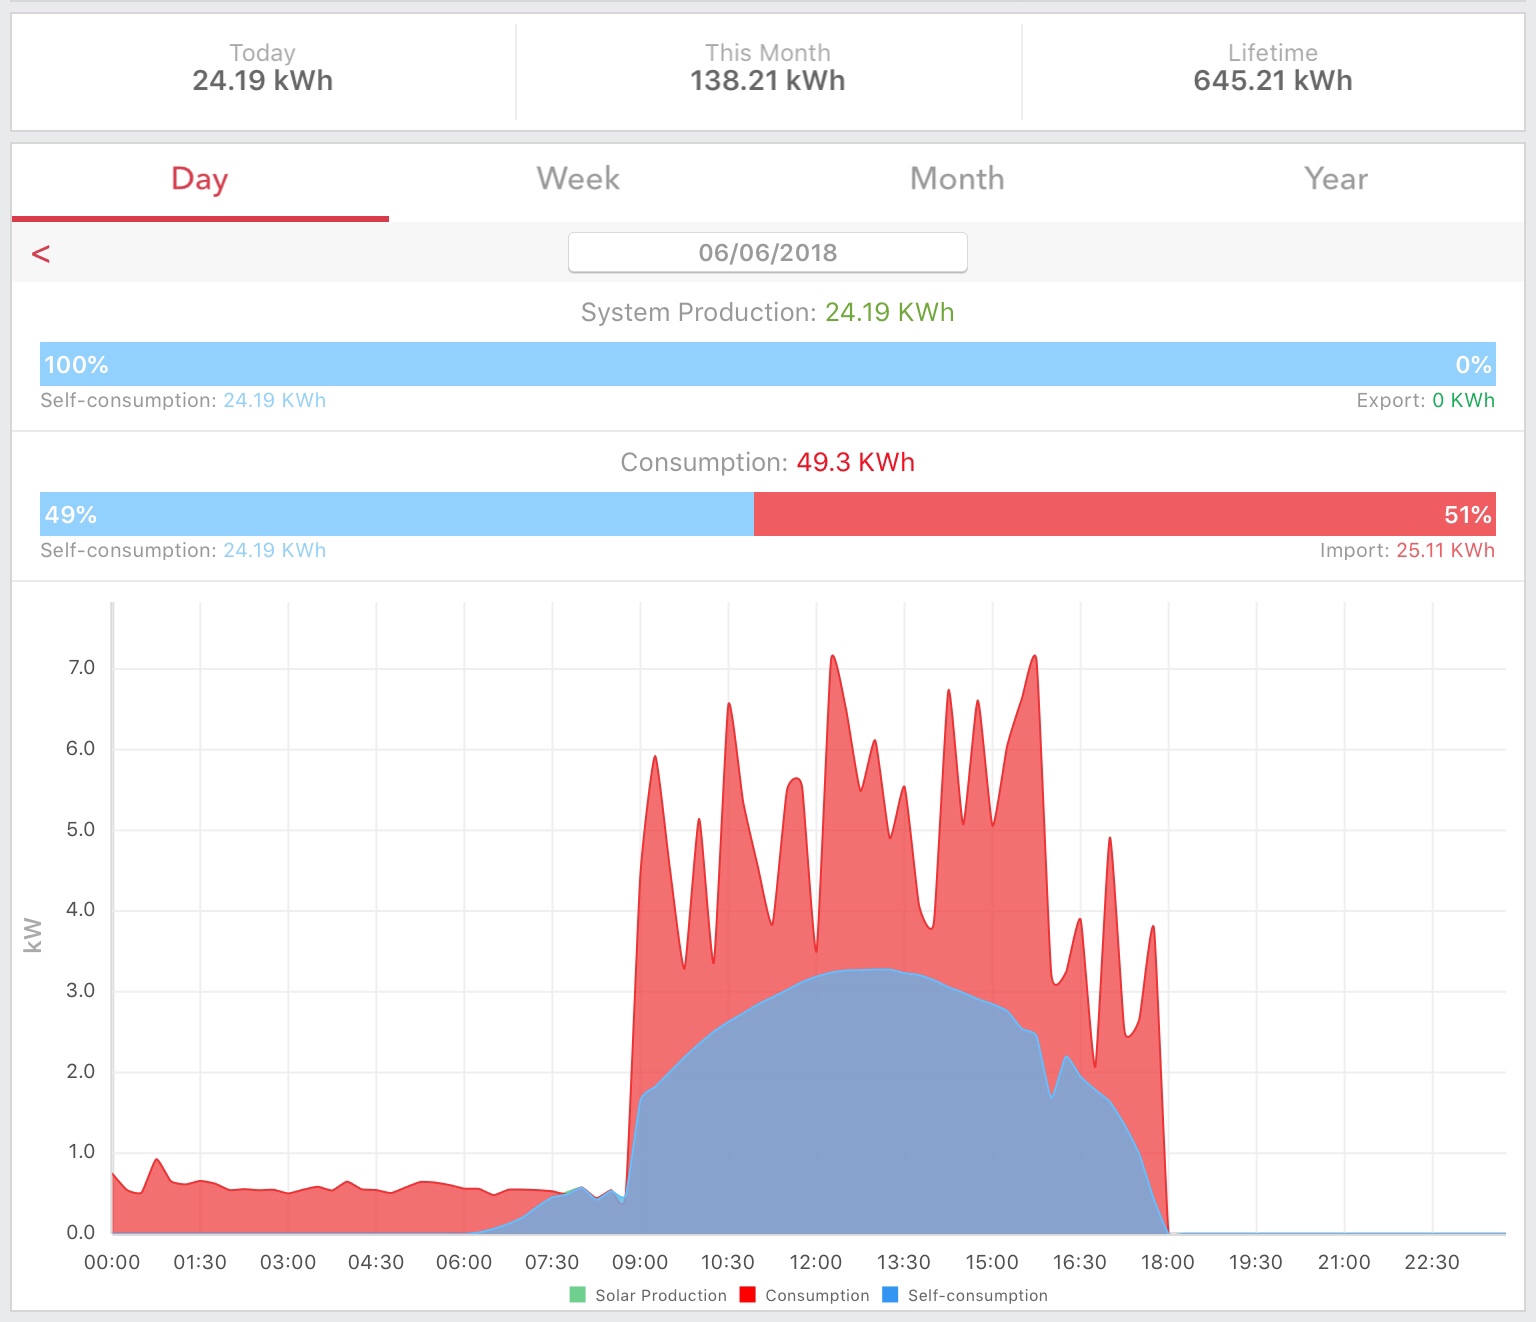
We are seven days from the end of 2021 with a stretch of sunny weather ahead, and I’m struck by the overall similarity of my power usage and solar production in 2020 and 2021.
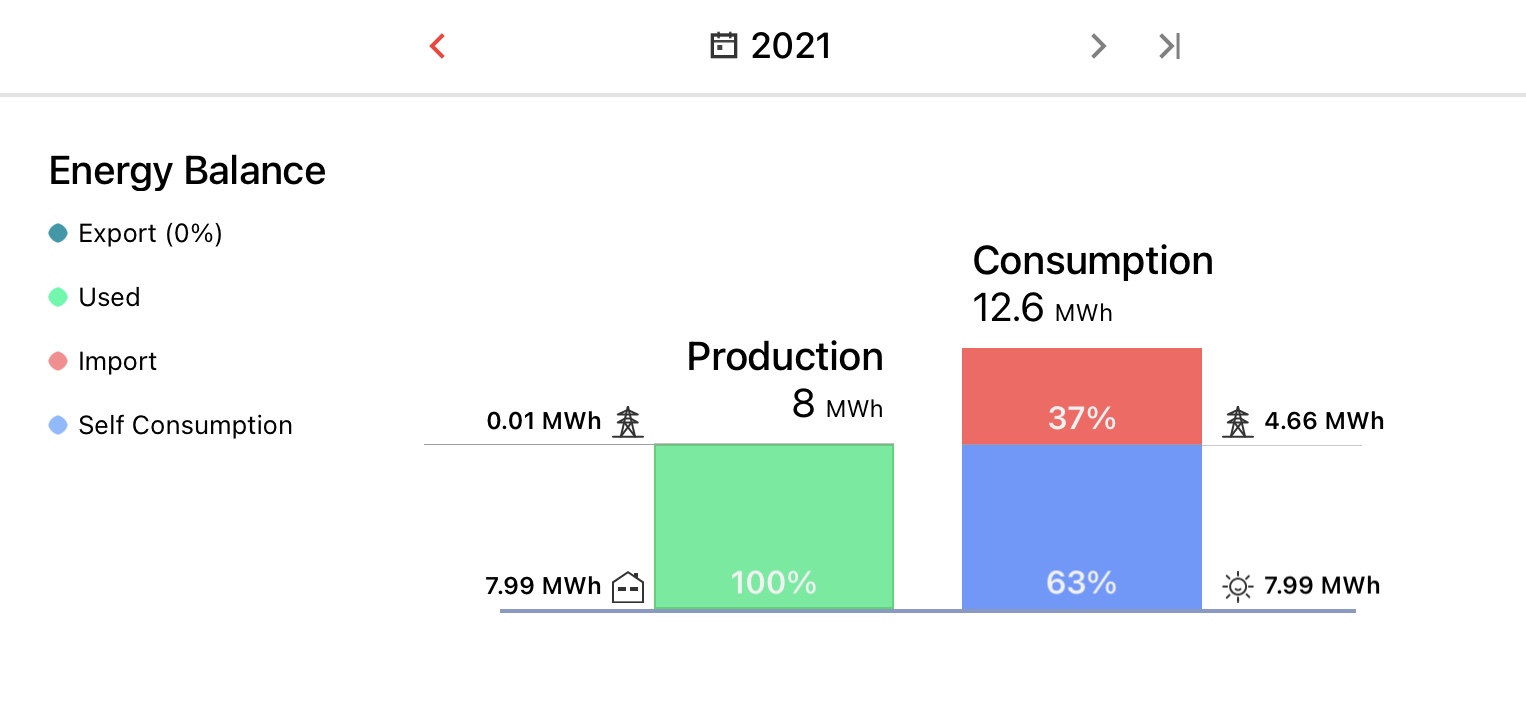
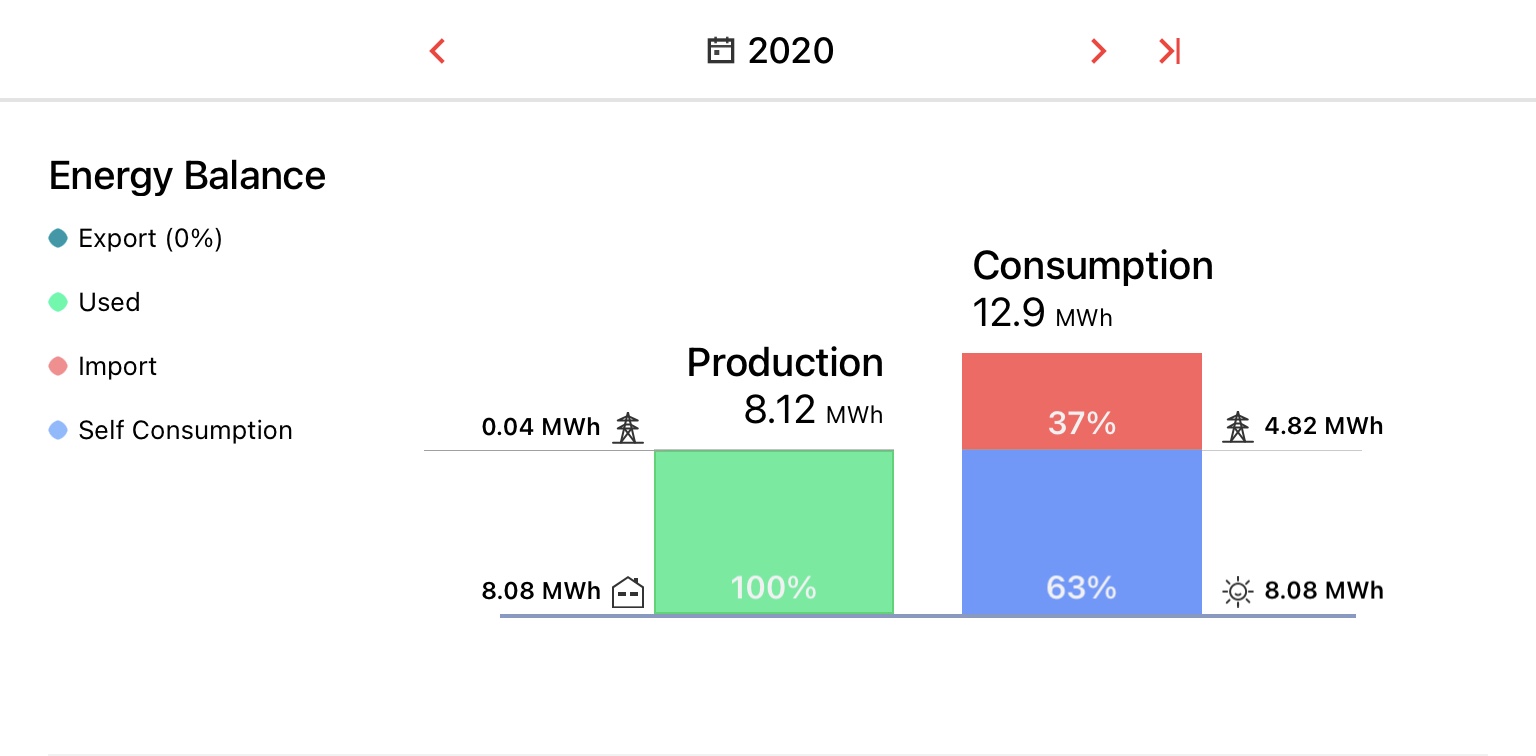
First, let’s take a look at the results here with summary graphs from each year.
We’ve used slightly less power (300 kWh) this YTD than last year, but most of that difference will be made up in the next week. Similarly, we’ll make about 100 kWh or a bit more over the week. We’ll have generated 63% of our power over this biennium.
Next, let’s look at weather and monthly grid import.
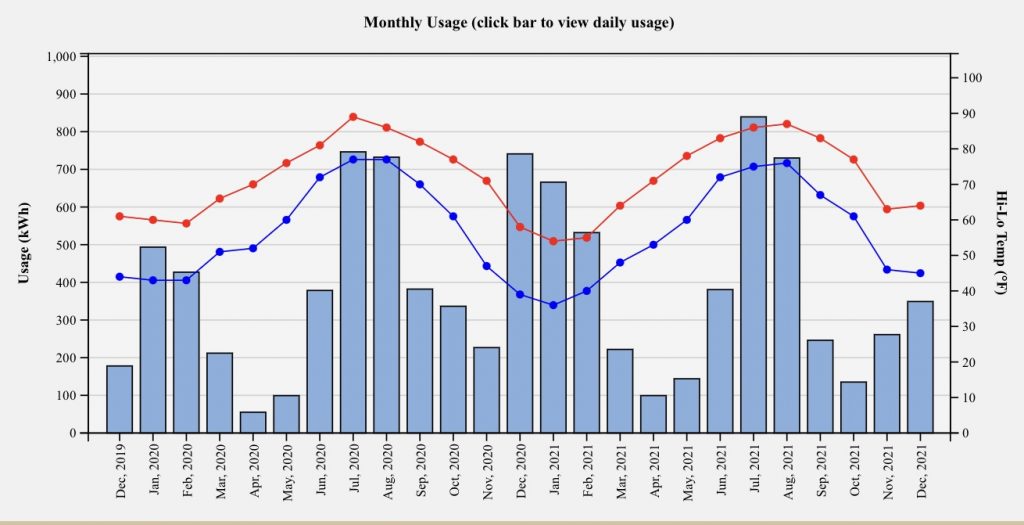
You’ll see that this is a very mild climate, with average highs under 90, and average lows generally above 40. Note that March, April, May, and then September, October, and November are the lowest external consumption. These are the shoulder seasons when HVAC usage is low, and especially in the spring, when production is high. High sun angle in the spring and cool temperatures are perfect for solar production.
For context, this is a 2100 sq ft house, built in 1993. There are just two of us here, and we work had to conserve energy. It’s “southern beach house” style, sitting up on 10 foot posts with a carport and utility rooms under. It has 3 HVAC systems, as a large addition was done in 2002 and it just worked out better to do that. We actually like this as having 3 zones gives a lot of flexibility for temperature management. We have a propane stove, but all other appliances are electric. All lights are LED, and we keep the temperature at 66 in the winter, and 77 in the summer. Baseline house load with no HVACs, water heater, or dishwasher running is 400 to 800 watts depending on which fridges and freezers are running). We could improve our curtailment of vampire loads. We get a lot of beneficial passive solar heat in the winter (love those sunny days that warm the house!), but that’s a double-edged sword with too much summer heat, too.
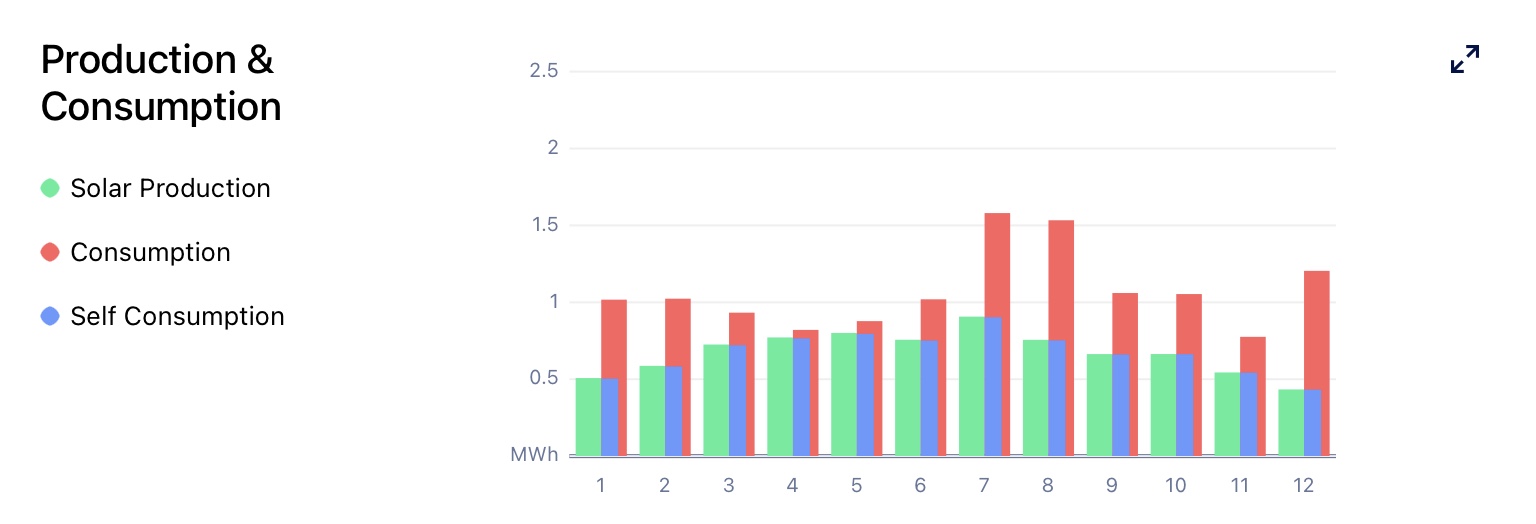
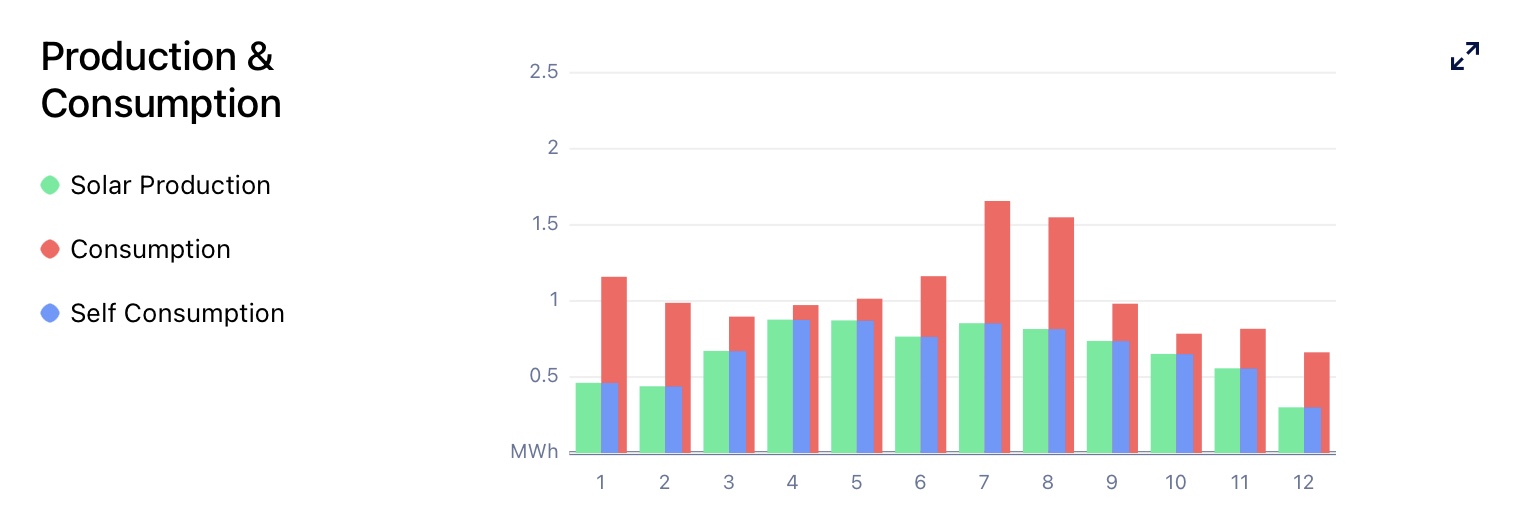
Now, let’s look at some of the differences in production and aggregate (not net) consumption on the graphs below. December 2020 was much colder than this year, and the difference in power imported is due to that and not just that December 2021 is missing a week. Summer import in 2020 was less than than in 2021. But generally, the cycle of high AC in the simmer and early fall with heat in the winter dominates seasonal consumption differences. The left graph below is 2020, and the right 2021.
However one thing that doesn’t show here is EV charging, which was about 50% higher in 2021 than 2020. In 2020 we put 1.4 MWh into the car. In 2021, this figure was 2.2 MWh. As a rule of thumb you can figure 4 miles per KWh. This home charging is not the total energy use, as this does not count any public charger use or use at the home of friends and family. I have better figures for 2021 on this than in 2020. Public charger usage was about 750 kWh and other charging was about 300 kWh, for an additional 1.05 MWh. This 3.25 MWh is consistent with the 12,800 miles on the car this year and an average of 3.9 to 4 miles per kWh. Without home EV charging in 2021, instead of 63% of energy, we’d show 77% of energy generated.
Our installation is 6.09 kWp (21 REC 290 watt panels) and one Tesla Powerwall configured for zero export. However, we have winter tree shading (in our neighbor’s yard) to the south, and only one row of panels is unaffected. I have 4 panels facing west instead of south, and another set of panels that gets shaded by parts of the house in the winter. My educated guess (and comparison with the results from the NREL PVWatts calculator) is that I’m losing about 1 MWh each year when compared to the ideal.
The bottom line is that rooftop solar can make a big contribution to meeting our energy needs. If you have a house with a southern exposure on the roof, you should look into it. Some utilities and rate structures make it easier and quicker to pay for the system, but it really works!

