Category Archives: Solar Power

Fun with home networks!

Interesting issue and potential solution to a connectivity problem with my home network… and I learned something about Eeros too. My configuration is a 2 node Eero mesh wifi network, running in bridge mode, connected to a Firewalla Purple as a router. About 50 devices including a large number of IoT things. At one time I used the Eero system for the router but I had very little visibility to the network flows. So I put in the Firewalla purple, which is a true router in a tiny box, with a lot of decent app tools for viewing flows (like who the IoT device is talking to!). It also has full shell access to the box, so you can do things like run PiHole if you want. But the Firewalla ad block is very good. Anyway, I digress.

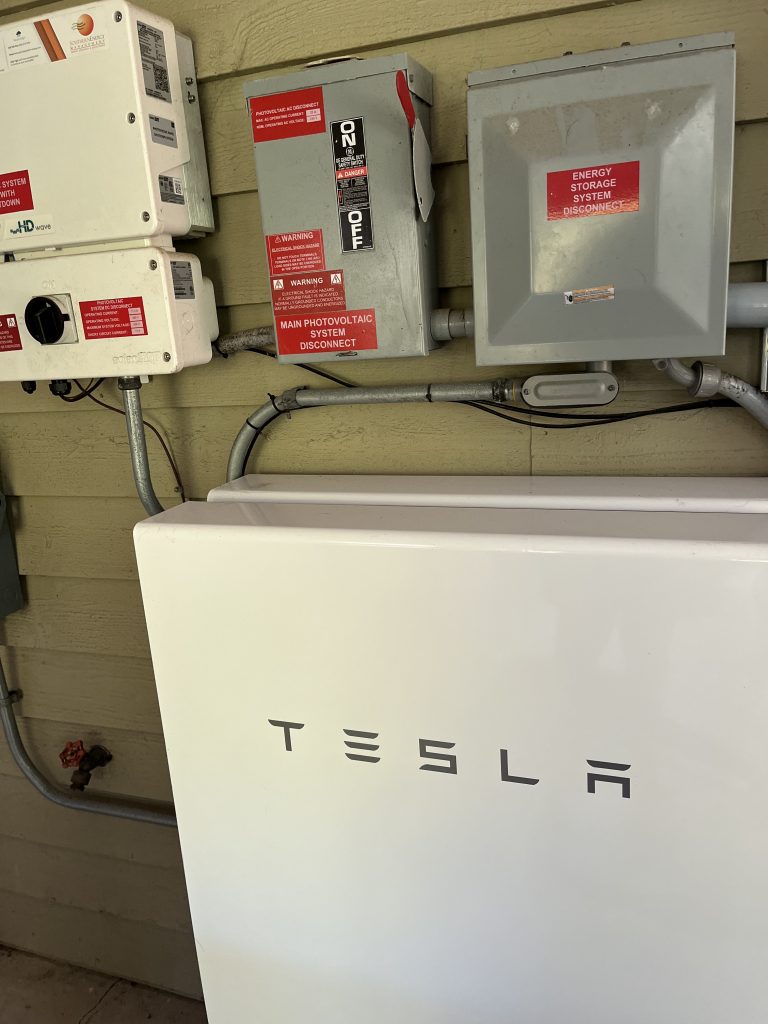
After months of stability in this configuration, about 3 weeks ago I started having problems with the Tesla Energy Gateway (TEG), which is the computer that manages the Powerwalls and the solar production. It was working fine, but periodically would lose connectivity to the Tesla mothership for data dump and visualization by the Tesla app. The most reliable way to reconnect was to reboot the Eeros and the Firewalla. Only doing the Firewalla didn’t fix it, and only doing the Eeros didn’t fix it. I called Tesla, and they said their logs showed a loss of connectivity, but that was it. As an aside, the TEG used to have cellular backup, but as it dated to 2017-2018, it used 3G, and now the backup modem is useless as the 3G networks have been shut down…and that may have masked this issue previously.

So, what’s the problem? I have an IoT device, the TEG, that gets OTA updates. I have a mesh WiFi that gets OTA updates. I have a router that get OTA updates. The Tesla mothership gets updates. So, honestly it could be any or all components.

I’d set up the Eero a while back to have the “guest” network for my IoT devices, but reconfiguration of all these guys is a pain, so I left that alone…until today. I decided to move the TEG to the Eero guest network. So far, the TEG is working, but the problem sometimes takes a day or two to show up, so I don’t know if I’ve fixed it yet and won’t until I’ve gone an extended time without issue.

But here’s the interesting part. The TEG started reporting to Tesla. The TEG still showed up on the Firewalla router with its old IP address, but showing disconnected and not passing traffic. I didn’t get a new device alarm on the Firewalla. If I looked at aggregate network flows, the communication to Tesla was visible. Hmmm. Then on the router, I looked at the mesh node where the TEG was connected. There was the traffic! And interestingly, the TEG was visible, and had a 192.168.XX.yy address on the Eero, but none of the nodes on the main SSID had IP addresses until they were handed to the Firewalla, and the “XX” in the address was a unique subnet. So what’s happening is that when you use a “guest” network on an Eero, even in bridge mode it acts like a router for the “guest” connections, which are thus isolated from everything else.

However, this sorta blows my efforts to track other IoT things by vendor, which is how I have them grouped on the Firewalla. Everything would be together, but it would be isolated. Gotta noodle on this! Anyway, I found it interesting but logical how the guest network functioned on the Eero, and thought someone else might, too…

A two year retrospective on solar energy

We are seven days from the end of 2021 with a stretch of sunny weather ahead, and I’m struck by the overall similarity of my power usage and solar production in 2020 and 2021.

First, let’s take a look at the results here with summary graphs from each year.

We’ve used slightly less power (300 kWh) this YTD than last year, but most of that difference will be made up in the next week. Similarly, we’ll make about 100 kWh or a bit more over the week. We’ll have generated 63% of our power over this biennium.

Next, let’s look at weather and monthly grid import.

Utility power consumption net of production

You’ll see that this is a very mild climate, with average highs under 90, and average lows generally above 40. Note that March, April, May, and then September, October, and November are the lowest external consumption. These are the shoulder seasons when HVAC usage is low, and especially in the spring, when production is high. High sun angle in the spring and cool temperatures are perfect for solar production.

For context, this is a 2100 sq ft house, built in 1993. There are just two of us here, and we work had to conserve energy. It’s “southern beach house” style, sitting up on 10 foot posts with a carport and utility rooms under. It has 3 HVAC systems, as a large addition was done in 2002 and it just worked out better to do that. We actually like this as having 3 zones gives a lot of flexibility for temperature management. We have a propane stove, but all other appliances are electric. All lights are LED, and we keep the temperature at 66 in the winter, and 77 in the summer. Baseline house load with no HVACs, water heater, or dishwasher running is 400 to 800 watts depending on which fridges and freezers are running). We could improve our curtailment of vampire loads. We get a lot of beneficial passive solar heat in the winter (love those sunny days that warm the house!), but that’s a double-edged sword with too much summer heat, too.

Now, let’s look at some of the differences in production and aggregate (not net) consumption on the graphs below. December 2020 was much colder than this year, and the difference in power imported is due to that and not just that December 2021 is missing a week. Summer import in 2020 was less than than in 2021. But generally, the cycle of high AC in the simmer and early fall with heat in the winter dominates seasonal consumption differences. The left graph below is 2020, and the right 2021.

However one thing that doesn’t show here is EV charging, which was about 50% higher in 2021 than 2020. In 2020 we put 1.4 MWh into the car. In 2021, this figure was 2.2 MWh. As a rule of thumb you can figure 4 miles per KWh. This home charging is not the total energy use, as this does not count any public charger use or use at the home of friends and family. I have better figures for 2021 on this than in 2020. Public charger usage was about 750 kWh and other charging was about 300 kWh, for an additional 1.05 MWh. This 3.25 MWh is consistent with the 12,800 miles on the car this year and an average of 3.9 to 4 miles per kWh. Without home EV charging in 2021, instead of 63% of energy, we’d show 77% of energy generated.

Our installation is 6.09 kWp (21 REC 290 watt panels) and one Tesla Powerwall configured for zero export. However, we have winter tree shading (in our neighbor’s yard) to the south, and only one row of panels is unaffected. I have 4 panels facing west instead of south, and another set of panels that gets shaded by parts of the house in the winter. My educated guess (and comparison with the results from the NREL PVWatts calculator) is that I’m losing about 1 MWh each year when compared to the ideal.

The bottom line is that rooftop solar can make a big contribution to meeting our energy needs. If you have a house with a southern exposure on the roof, you should look into it. Some utilities and rate structures make it easier and quicker to pay for the system, but it really works!

Solar update

The solar system went live on April 18th, so we’ve had it for about 7 weeks. It’s been interesting, as my awareness of energy consumption has increased dramatically with the monitoring data from the system, and we’ve changed some habits and practices. Also, as “technology” goes, this is dead level easy. Once it’s installed, it just quietly does its job. There will be more later in another post on this “quiet” statement; one side effect is increased RF noise which creates some HAM radio issues.

Now for some details. First, let me say that the system isn’t complete yet, as the Tesla Powerwall battery has not been installed, since it was on backorder. It’s arrived now at the installer, and should be in by the end of June. Also, note that my utility does not support Net Metering, so I have to consume all of my generated power in real time, or store it. Since the battery is not currently in, I’ve left a lot of energy on the table. As we have looked at the consumption patterns, it’s easy to discern when the HVACs run, the water heater runs, the dryer, and other things turn on. We’ve made some adjustments, replaced some lights with LEDs, and we take shorter showers. One of the big items is the battery electric car, a Chevy Bolt. It runs entirely on electricity and has a massive 60 kWh battery. One of the big adjustments we’ve made has been in how we charge the car. Instead of charging as fast as possible, at 7.2 kW per hour, I’ve slowed down the charge to about 40% of that, 2.8 kW. I’ve also set it to charge from 9 to 4 when the solar output is at its highest. The JuiceBox charger makes this easy to manage thru its app. If I need to use the car for long drives on consecutive days, I can increase the rate and draw more from the grid. But if not, let the car capture the sun! The Powerwall, when in, will capture any generated power not otherwise used, and can use that energy after the sun goes down, or for backup power if the grid is out.

So what are the results? We were away from home for 3 weeks in May, so that skews the data, tho the HVACs were on, and we had some construction underway. Here’s the picture so far:

The system has captured, as of this snapshot, 643.55 kWh of power over 54 days. That’s about 12 kWh per day. However, it’s a mix of very low days where 14 kWh Powerwall would have grabbed much more power had it been online, and 20+ kWh days in late May and early June where car charging and HVAC grabbed virtually all generated power. June production, over just 6 days, is over 135 kWh! The projected production with the Powerwall is approximately 16 kWh per day on average.

The car has received 300 kWh over this same time (out of 1.62 mW total consumption), but I think that is slightly understated due to a couple network glitches. Here’s a graph that shows the car charging at 2.8 kW from 9 to 4, with HVAC use skewed late in the day. Note that the house has three relatively old and inefficient HVACs and when these are replaced, the total consumption will drop significantly.

So what’s the bottom line? I think that with the Powerwall the projected production of approximately 5,900 kWh annually is very doable, and I’ll probably exceed that. My savings should be on the order of $600 per year, at current power prices. Assuming modest inflation in grid power, it will pay off in 20 to 25 years. But it’s the right thing to do, and I’ll also have an emergency power system. Also, the instrumentation and data will help to shape conservation efforts over time and that is also a hidden savings.

A fortnight with solar panels

Well, it’s actually only been 13 days, not two weeks, but close enough, since the installation started a couple days earlier. Our system was installed by Southern Energy Management, based in Morrisville, NC, who did an outstanding job. The system installed is composed of 15 REC TwinPeak 290 panels, 11 facing due south and 4 facing west, for a nominal capacity of 4.35 kW. The plan had been for all to face south, but the roof layout and potential for shading dictated the placement. With some of the panels facing west, the peak capacity is slightly less, but the “tail” of power generation is longer in the afternoon, due to the west-facing panels. These are connected to a 6000 W single-phase SolarEdge inverter. I asked for an inverter of higher capacity in case I ever wanted to add a few more panels.

Actually, the system isn’t complete yet, as we’ve got a Tesla Powerwall on order (on backorder, like everything else Tesla makes 😉 ) but telemetry from Southern Energy is that we’ll get it in August, so that’s at least on the roadmap. The Powerwall is an important part of the installation as the local utility does not offer “Net Metering.” This is the arrangement with your utility where you can sent your generated but unused power to the grid and you receive payment for each kWh that you send to the grid. So, we have to use all the power we generate, or it evaporates. That’s where the Powerwall comes in. It has a 13.5 kWh capacity, and absorbs power when you are not using it in the house. The solar system feeds the Powerwall, and the Powerwall then supplies current to the house at 5 kW continuous, 7 kW peak. It will supply power when the sun is down, or if a cloud passes over when a large load comes online. This should enable self-consumption of most of the power generated by the panels.

Currently, we’d be wasting a lot of potential power without being smart about when to run various appliances. For example, run the washing machine, dryer, and dishwasher between 10 and 4 (DST). Take showers mid-day as well, as the water heater is a big power draw. But the big thing is to intelligently manage charging of the electric car. It can hold 60 kWh of power, far more than can be generated, and can accept a charge at up to 7.2 kW. However, the JuiceBox Pro 40 EVSE we have for charging can set various charge rates below its 10 kW maximum, and by spreading the charge out during the sunny part of the day (when you don’t have to charge fast), you can capture much more of the solar power. Here’s a graph that shows this clearly. The JuiceBox is set to charge at a maximum of 3.6 kW.

The large “flat” peak is the car charge from about 0930 to 1530, for about 6 hours at 3.6 kW, or around 21-22 kW of demand. Note, however, that the system peaked at about 3.6 kW for only a short while at “noon” (1 PM DST). The demand from the car, combined with the baseline load of about .5 kW was more than the power that could be generated. The sharp peaks are the water heater, or at 0800 coffee and breakfast, and at 1730, cooking dinner. However, the solar still covered 54% of the house demand, and captured nearly 24 kWh. The Powerwall will work in the same way, capturing power left on the table to cover the overnight hours you can see on each side of the graph. We don’t charge the car every day, and this is where the automatic charge of the Powerwall will be very helpful. Without charging the car, usage that would be covered is more like 5-8 kWh. This, of course, is in a shoulder season without the heat pumps running, and we’ll see how that impacts overall consumption. The Powerwall, however, will ensure that we grab at least 20 kWh or so each day when the sun is shining.

Stay tuned for future analysis once we get the Powerwall in place. It’s really interesting to see how you use your electricity, and it can prompt changes in behavior.