The solar system went live on April 18th, so we’ve had it for about 7 weeks. It’s been interesting, as my awareness of energy consumption has increased dramatically with the monitoring data from the system, and we’ve changed some habits and practices. Also, as “technology” goes, this is dead level easy. Once it’s installed, it just quietly does its job. There will be more later in another post on this “quiet” statement; one side effect is increased RF noise which creates some HAM radio issues.
Now for some details. First, let me say that the system isn’t complete yet, as the Tesla Powerwall battery has not been installed, since it was on backorder. It’s arrived now at the installer, and should be in by the end of June. Also, note that my utility does not support Net Metering, so I have to consume all of my generated power in real time, or store it. Since the battery is not currently in, I’ve left a lot of energy on the table. As we have looked at the consumption patterns, it’s easy to discern when the HVACs run, the water heater runs, the dryer, and other things turn on. We’ve made some adjustments, replaced some lights with LEDs, and we take shorter showers. One of the big items is the battery electric car, a Chevy Bolt. It runs entirely on electricity and has a massive 60 kWh battery. One of the big adjustments we’ve made has been in how we charge the car. Instead of charging as fast as possible, at 7.2 kW per hour, I’ve slowed down the charge to about 40% of that, 2.8 kW. I’ve also set it to charge from 9 to 4 when the solar output is at its highest. The JuiceBox charger makes this easy to manage thru its app. If I need to use the car for long drives on consecutive days, I can increase the rate and draw more from the grid. But if not, let the car capture the sun! The Powerwall, when in, will capture any generated power not otherwise used, and can use that energy after the sun goes down, or for backup power if the grid is out.
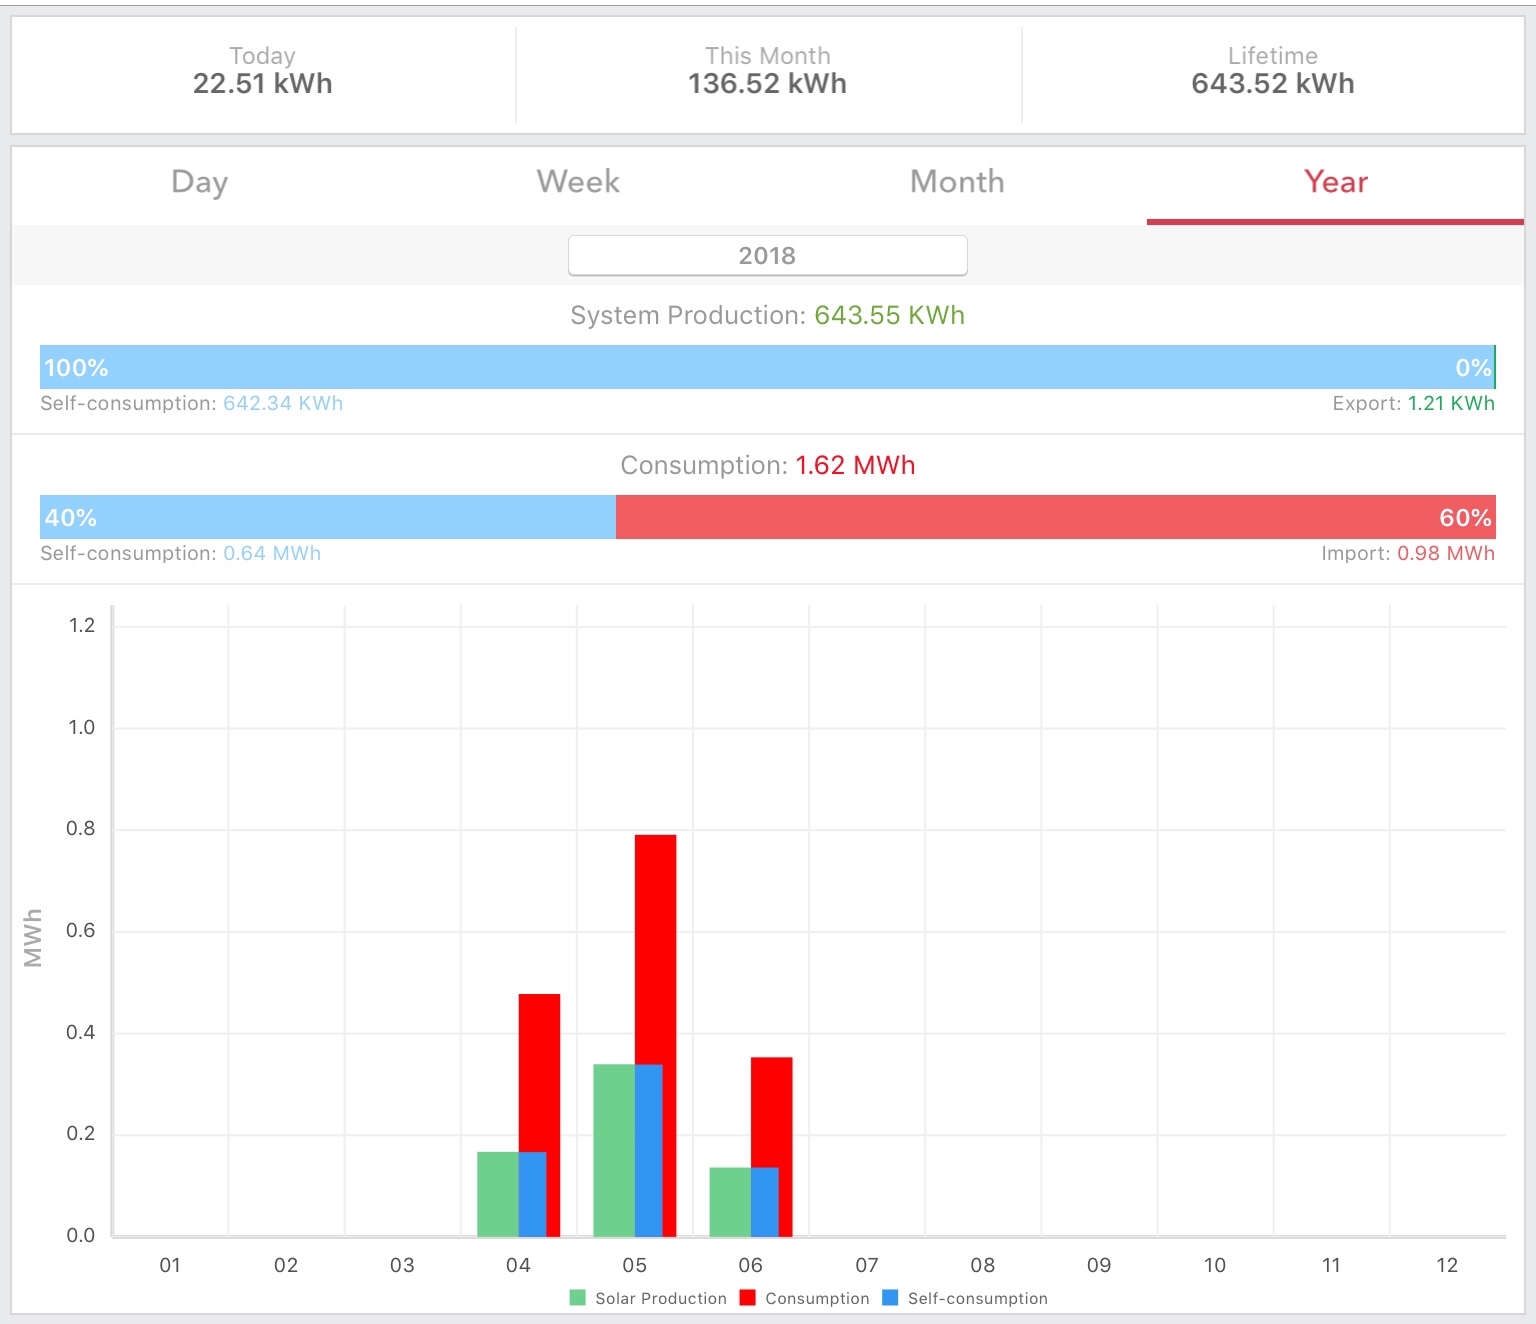
So what are the results? We were away from home for 3 weeks in May, so that skews the data, tho the HVACs were on, and we had some construction underway. Here’s the picture so far:

The system has captured, as of this snapshot, 643.55 kWh of power over 54 days. That’s about 12 kWh per day. However, it’s a mix of very low days where 14 kWh Powerwall would have grabbed much more power had it been online, and 20+ kWh days in late May and early June where car charging and HVAC grabbed virtually all generated power. June production, over just 6 days, is over 135 kWh! The projected production with the Powerwall is approximately 16 kWh per day on average.
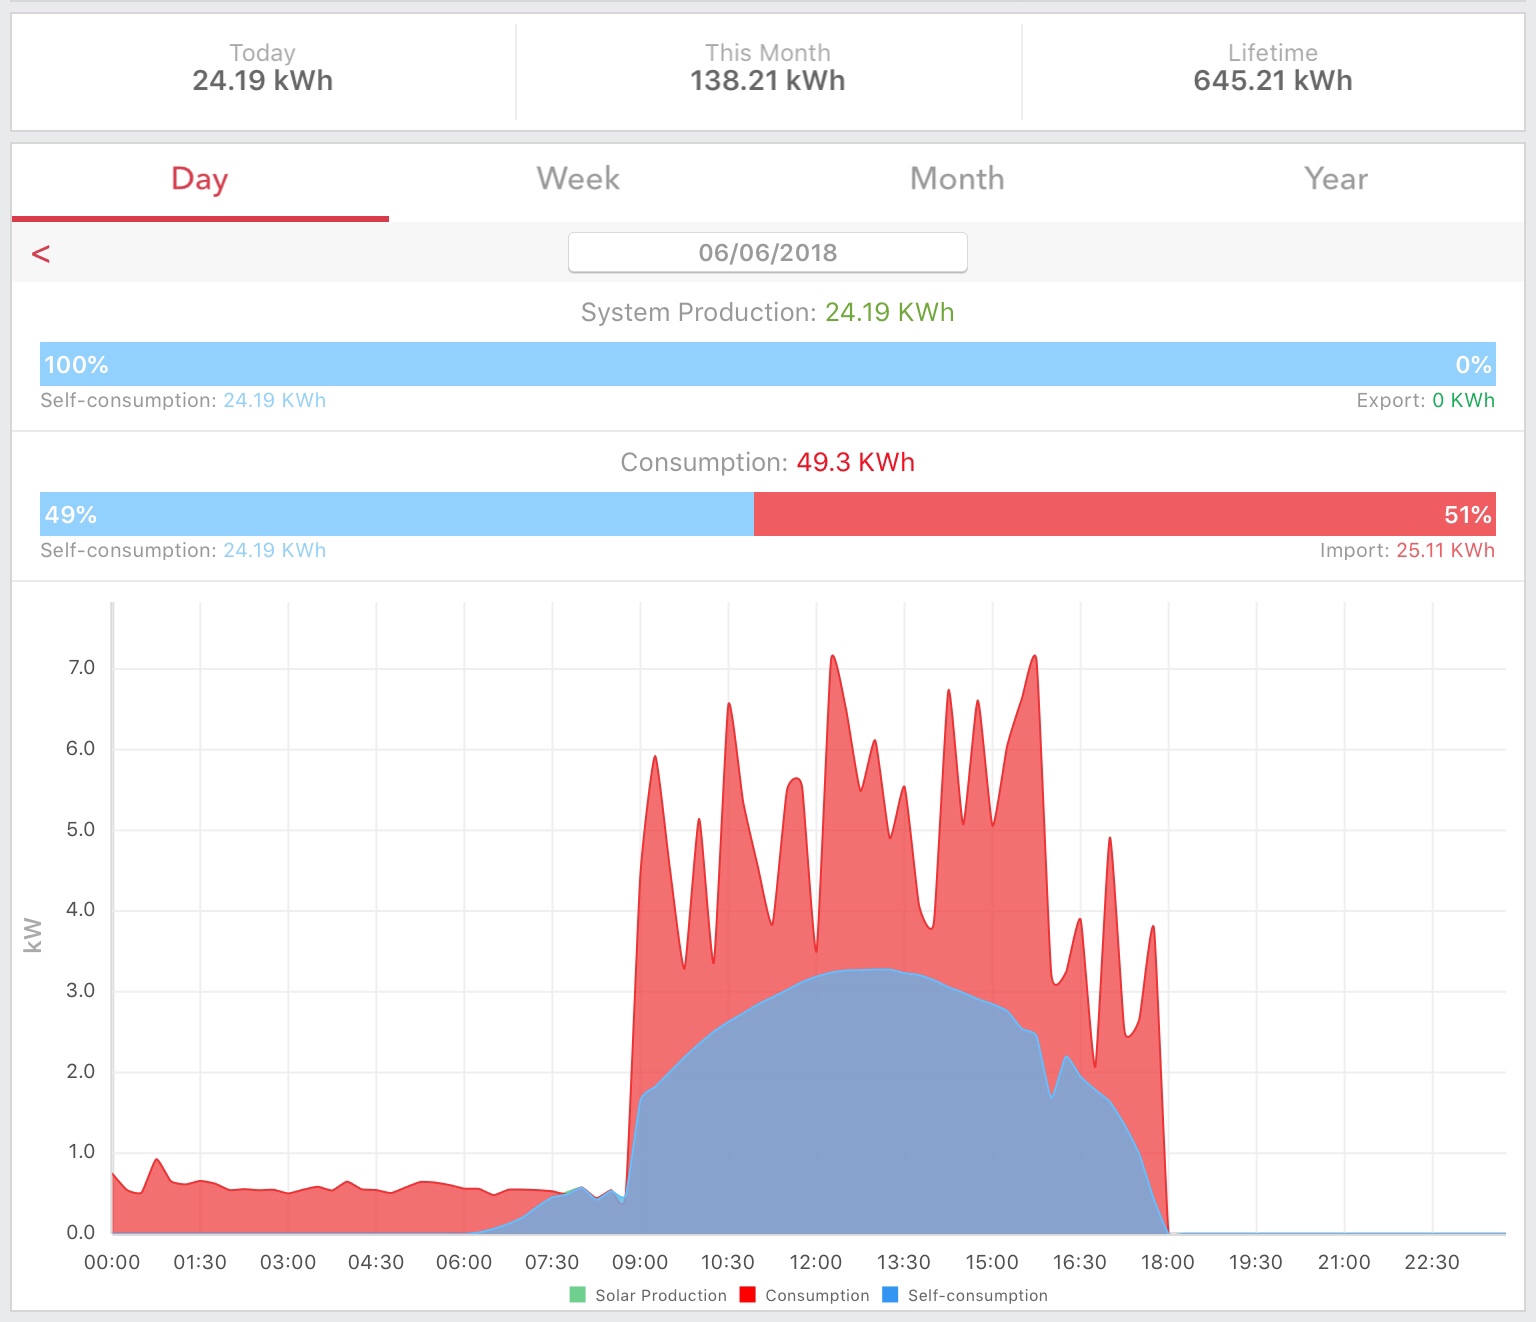
The car has received 300 kWh over this same time (out of 1.62 mW total consumption), but I think that is slightly understated due to a couple network glitches. Here’s a graph that shows the car charging at 2.8 kW from 9 to 4, with HVAC use skewed late in the day. Note that the house has three relatively old and inefficient HVACs and when these are replaced, the total consumption will drop significantly.

So what’s the bottom line? I think that with the Powerwall the projected production of approximately 5,900 kWh annually is very doable, and I’ll probably exceed that. My savings should be on the order of $600 per year, at current power prices. Assuming modest inflation in grid power, it will pay off in 20 to 25 years. But it’s the right thing to do, and I’ll also have an emergency power system. Also, the instrumentation and data will help to shape conservation efforts over time and that is also a hidden savings.
